Use Spendzila's free calculators to apply what you learn in this article instantly.
Open Free Tools →
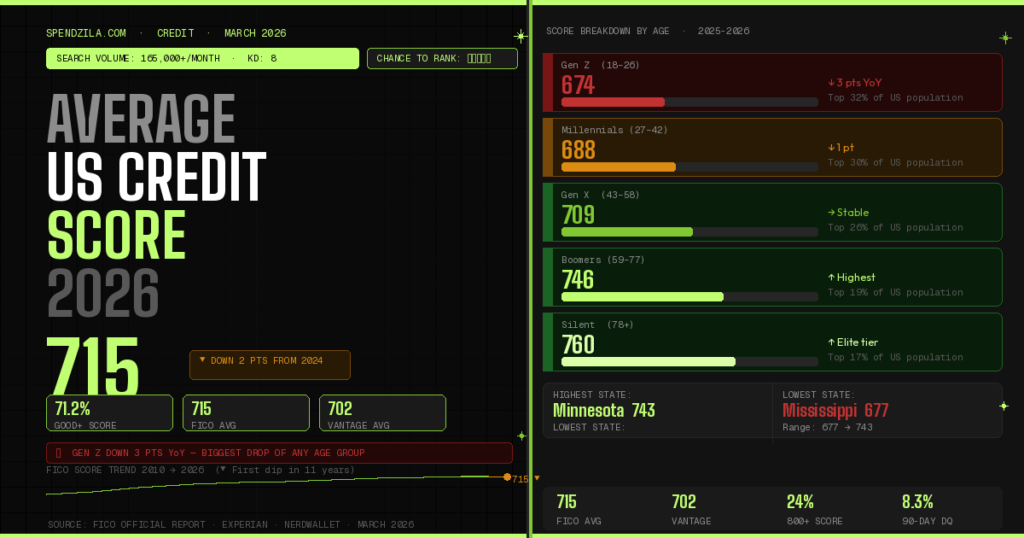
🆕 National average FICO score: 715 — DOWN 2 points from 717 in 2024
⚠️ First decline in 11 consecutive years of steady increases
📈 90-day delinquencies: 8.3% — now above pre-pandemic levels for first time
👑 Gen Z hit hardest: down 3 points year-over-year — largest drop of any age group
📚 Cause: Student loan delinquency reporting resumed Feb 2025 + rising credit card debt
The current average credit score in the United States in 2026 is 715 — and for the first time in 11 years, that number is heading in the wrong direction. The national FICO average dropped 2 points from its 2024 peak of 717, driven by the resumption of student loan delinquency reporting, rising credit card balances, and a wave of missed payments now exceeding pre-pandemic levels.
This complete guide breaks down the average US credit score in 2026 by age, state, income level, generation, and year — with all data verified from official FICO, Experian, NerdWallet, and Motley Fool sources through March 2026. Whether you want to know where you stand, how you compare, or what to do to improve, every answer is here.
| Metric | 2026 Value | Change | Source |
|---|---|---|---|
| Average FICO Score (national) | 715 | ▼ Down 2 pts from 717 | FICO Official (Apr 2025) |
| Average VantageScore (national) | 702 | Stable since Mar 2025 | VantageScore / NerdWallet |
| % with Good+ score (670+) | 71.2% | Slight decline from 71.3% | Experian (2025) |
| % with Exceptional score (800+) | 24% | Increased from 23% | Experian / Motley Fool 2025 |
| Highest state average | Minnesota: 743 | ↑ 1 pt from 742 | FICO / Motley Fool (Sept 2025) |
| Lowest state average | Mississippi: 677 | ↓ 3 pts from 680 | FICO / Motley Fool (Sept 2025) |
| 90-day delinquency rate | 8.3% | ▲ Above pre-pandemic (8.1%) | FICO Official (Feb 2025) |
The 715 national average places the typical American in FICO’s “Good” tier (670–739). This is high enough to qualify for most credit cards, auto loans, and mortgages — but not high enough to secure the absolute best interest rates, which typically require 740+ (Very Good) or 760+ (for top mortgage rates in 2026’s tightened lending environment).
Age is one of the strongest predictors of credit score — not because lenders consider age directly (they don’t), but because older Americans have longer credit histories, more established credit lines, and decades of payment experience. Here is the complete breakdown of average FICO scores by age as of 2025–2026:
| Age Group | Avg FICO Score (2026) | FICO Tier | YoY Change |
|---|---|---|---|
| 18–25 (Gen Z, younger) | 674 | Fair | ▼ Biggest drop |
| 26–41 (Millennials) | 688 | Good (low) | ▼ Slight decline |
| 42–57 (Gen X) | 709 | Good | → Stable |
| 58–76 (Baby Boomers) | 746 | Very Good | ↑ Slight increase |
| 77+ (Silent Generation) | 760 | Very Good / Near Exceptional | ↑ Steady improvement |
Sources: Experian (2025), Motley Fool (Sept 2025), NerdWallet (Dec 2025), FICO Credit Insights Report (2025).
Why does the average credit score increase with age? Three core reasons: (1) Longer credit history — which accounts for 15% of your FICO score, and accumulates automatically over time. (2) Lower credit utilization — older Americans generally have higher credit limits, existing mortgages paid down, and less reliance on revolving credit. (3) Better payment habits — decades of managing bills creates discipline that shows up in payment history, the single largest factor at 35% of your FICO score.
The FICO Credit Insights Report (September 2025) — FICO’s first-ever comprehensive generational analysis — revealed a striking divergence: while older Americans held steady or improved, Gen Z experienced the sharpest single-year decline of any age group in modern FICO history.
| Generation | Birth Years | Avg FICO (2026) | YoY Change | Key Driver |
|---|---|---|---|---|
| Generation Z | 1997–2012 | 674 | ▼ −3 pts (largest drop) | Student loans, 34% hold student debt |
| Millennials | 1981–1996 | 688–691 | ▼ −1 to −2 pts | Credit card debt ($6,360 avg), HELOC growth |
| Generation X | 1965–1980 | 709 | → Stable (0–1 pt) | Peak earnings offset by high debt loads |
| Baby Boomers | 1946–1964 | 746 | ↑ Slight improvement | Paid-off mortgages, pension income, low utilization |
| Silent Generation | 1928–1945 | 760 | ↑ Improving | Decades of credit, low utilization, minimal new debt |
Credit scores vary significantly across the United States, reflecting regional differences in income, cost of living, local economies, and financial culture. The full 2025–2026 state breakdown from FICO (via Motley Fool, September 2025) and WalletHub shows a 66-point spread from the highest to lowest state:
| Rank | State | Avg FICO Score | Tier |
|---|---|---|---|
| #1 | Minnesota | 743 | Very Good |
| #2 | Vermont | 740 | Very Good |
| #3 | New Hampshire | 738 | Very Good |
| #4 | Wisconsin | 737 | Very Good |
| #5 | Washington | 734 | Very Good |
| #6 | Massachusetts | 732 | Very Good |
| #7 | Oregon | 731 | Very Good |
| #8 | Hawaii | 730 | Very Good |
| #9 | Colorado | 728 | Very Good |
| #10 | Connecticut | 727 | Very Good |
| Rank | State | Avg FICO Score | Tier |
|---|---|---|---|
| #50 (lowest) | Mississippi | 677 | Fair/Good border |
| #49 | Louisiana | 682 | Good (low) |
| #48 | Alabama | 686 | Good (low) |
| #47 | Arkansas | 690 | Good (low) |
| #46 | Oklahoma | 692 | Good (low) |
| #45 | West Virginia | 693 | Good (low) |
| #44 | Texas | 695 | Good |
| #43 | Georgia | 697 | Good |
| #42 | Nevada | 698 | Good |
| #41 | South Carolina | 699 | Good |
The geographic pattern is clear: Northern and Western states consistently outperform Southern states in average credit scores. Economists point to differences in median household income, access to financial education, local unemployment rates, and the concentration of industries that provide stable employment. All 10 of the lowest-scoring states are in the South, according to LendingTree analysis.
While income is not a direct factor in FICO or VantageScore calculations, it strongly correlates with credit score performance — because higher income makes it easier to pay bills on time and keep utilization low, the two most important scoring factors.
| Income Bracket | Definition (% of Area Median) | Typical Credit Score Range | Score Tier |
|---|---|---|---|
| High Income | >120% of area median | 750–850 | Very Good → Exceptional |
| Medium Income | 80%–120% of area median | 710–749 | Good → Very Good |
| Moderate Income | 50%–79% of area median | 670–709 | Good |
| Low Income | <50% of area median | 580–669 | Fair |
Source: New York Fed Consumer Credit Panel / Equifax. Definitions from Federal Reserve income bracket classifications.
The 11-year streak of improvement that followed the Great Recession has officially ended. Here is the complete historical record:
| Year | Avg FICO Score | Change | Key Event |
|---|---|---|---|
| 2010 | 687 | Baseline (post-recession low) | Great Recession recovery begins |
| 2015 | 700 | ↑ +13 pts | Steady economic expansion |
| 2019 | 703 | ↑ +3 pts | Pre-pandemic peak, low unemployment |
| 2021 | 714 | ↑ +11 pts | Pandemic stimulus, student loan pause, payment forbearance |
| 2023 | 715 | ↑ +1 pt | Post-stimulus normalisation |
| 2024 | 717 | ↑ +2 pts (peak) | Low unemployment, inflation easing, Fed rate cuts |
| 2026 (current) | 715 | ▼ −2 pts — FIRST DECLINE IN 11 YEARS | Student loan delinquency reporting resumes, rising card debt |
FICO’s official analysis (April 2025) identified three clear drivers behind the first annual decline in 11 years:
The CARES Act student loan pause lasted from March 2020 through September 2023, followed by a one-year “on-ramp” grace period through September 2024. Beginning February 2025, the Department of Education resumed reporting federal student loan delinquencies to the three credit bureaus. Millions of borrowers who had missed payments during the transition period now saw those delinquencies appear on their credit reports — causing immediate score drops across the population, with Gen Z (34% of whom hold student loans) hit hardest.
The share of consumers with a 90+ day delinquency in the past six months increased from 7.4% in January to 8.3% in February — a 12% relative rise, and the first time this figure has surpassed pre-pandemic levels of 8.1% in January 2020. This is the most important single statistic in the 2026 credit landscape: serious delinquencies are now worse than before COVID, meaning the pandemic’s temporary credit improvement has fully reversed.
The average American now carries $6,360 in credit card debt — up from $5,900 in 2024 (Federal Reserve data). Average credit utilization reached 35.5% in 2025, well above the 30% threshold that FICO considers damaging to credit scores. With the average credit limit around $30,000, consumers are using a larger share of their available credit than any point since 2019, pushing scores down at the 30%-weighted utilization factor.
| FICO Score Range | Tier Label | % of Americans | What It Means |
|---|---|---|---|
| 800–850 | Exceptional | 24% | Best rates on all products; instant approvals |
| 740–799 | Very Good | ~25% | Near-best rates; strong approval odds |
| 670–739 ← YOU ARE HERE (avg: 715) | Good | ~22% | Approved for most products; rates above best tier |
| 580–669 | Fair | ~17% | Limited options; high interest rates; secured cards |
| 300–579 | Poor | ~16% | Difficulty qualifying; predatory loan risk zone |
There are two major credit scoring models, and they produce different averages — which is why you’ll sometimes see 715 and 702 quoted as the “average US credit score” in the same article. Here’s the difference:
| Feature | FICO Score | VantageScore 4.0 |
|---|---|---|
| 2026 National Average | 715 | 702 |
| Used by top lenders | 90% of top US lenders | Growing; now Fannie Mae / Freddie Mac approved (July 2025) |
| Score range | 300–850 | 300–850 |
| Developed by | Fair Isaac Corporation (1956) | Equifax + Experian + TransUnion (2006) |
| Alternative data | Traditional credit data only | Rent, utilities, phone payments included |
| People scored | ~230M Americans | 33M more people scored than FICO (thinner files) |
Which score matters more? For mortgages, auto loans, and most credit cards, lenders use FICO — it is the industry standard, referenced by 90% of top US lenders. However, VantageScore’s inclusion in Fannie Mae and Freddie Mac guidelines since July 2025 means it now matters for mortgage qualification too. Check both scores: you can get your FICO score free at myFICO.com or through many banks, and your VantageScore free at Credit Karma.
The national average of 715 is “good” — but good is not the same as optimal. Here is what each tier unlocks in 2026’s lending environment:
| Score Tier | Range | Mortgage Rate (est.) | Auto Loan Rate | Credit Card APR |
|---|---|---|---|---|
| Exceptional | 800–850 | ~5.8%–6.2% | ~4.5%–5.5% | ~16%–18% |
| Very Good | 740–799 | ~6.0%–6.5% | ~5.5%–7.0% | ~18%–22% |
| Good (US Average: 715) | 670–739 | ~6.5%–7.2% | ~7.0%–11% | ~22%–27% |
| Fair | 580–669 | ~7.5%–9%+ | ~12%–18% | ~27%–35% |
| Poor | 300–579 | Often denied | ~18%–28%+ | Secured cards only; 28%–36% |
A key 2026 shift: mortgage underwriting has tightened significantly. The average credit score for approved mortgage borrowers is now 760 — in the Very Good tier — up from 750+ in prior years. If you’re planning to buy a home in 2026, the 715 national average may not be enough to secure competitive rates. You need to target 740+ for good rates and 760+ for the best.
The national average dropped to 715 — but that doesn’t mean you have to. Here are the seven highest-impact moves to push your score above 740 (Very Good) as fast as possible:
Average US credit utilization hit 35.5% in 2025 — well above the 30% threshold that starts hurting your score. Every $1,000 in credit card balance you pay down reduces your utilization ratio and can improve your score within 30 days (credit card issuers report balances monthly). Target below 10% utilization for maximum score impact. On a card with a $10,000 limit, that means keeping your balance under $1,000.
Payment history is the single largest FICO factor at 35%. One 30-day late payment can drop your score by 50–100 points and stays on your report for 7 years. Set autopay for at least the minimum payment on every account, every month. This one action protects more of your score than anything else on this list.
Get your free reports at AnnualCreditReport.com. Studies show that 1 in 5 credit reports contain errors — wrong account balances, incorrect late payments, accounts that don’t belong to you. Under the Fair Credit Reporting Act (FCRA), bureaus must investigate disputes within 30 days. Removing a single erroneous late payment or collection can boost your score dramatically.
Ask a family member or trusted friend with excellent credit (800+, long history, low utilization) to add you as an authorized user on their oldest credit card. Their account history immediately appears on your credit report. Real user data from NerdWallet shows scores jumping from 496 to 660 — a 164-point improvement — within 3 months using this method.
Experian Boost is a free tool that adds your on-time utility, phone, and streaming service payments to your Experian credit file. The average user sees a 13-point increase instantly. It only affects your Experian-based scores, but since many lenders use Experian, it’s worth doing in the next 5 minutes.
Closing an old card shrinks your available credit (raising utilization) and can reduce the average age of your accounts (hurting your length-of-history factor). Instead, keep the account open and make one small recurring charge — like a $5/month streaming subscription — paid automatically. The card stays active without tempting you to overspend.
Given that 34% of Gen Z and 17% of all Americans hold student loan debt, and delinquencies from the post-COVID period are now being reported, contact your loan servicer immediately if you’ve missed any federal student loan payments since October 2023. The “Fresh Start” program may still offer options to rehabilitate defaulted loans and reduce credit damage. Act before the delinquencies compound.
For the complete 11-step guide to improving your credit score, including real timelines and dollar savings by tier, see: How to Improve Your Credit Score in 2026
The current average US credit score is 715 (FICO) as of March 2026, based on official FICO data. The average VantageScore is 702. The FICO average is down 2 points from 717 in 2024 — the first annual decline in 11 consecutive years of improvement.
Average FICO scores by generation in 2026: Gen Z: 674 | Millennials: 688 | Gen X: 709 | Baby Boomers: 746 | Silent Generation: 760. Scores rise with age due to longer credit histories, lower utilization, and decades of on-time payments.
Minnesota (743) has the highest average credit score in 2026, according to FICO data cited by Motley Fool (September 2025). Mississippi (677) has the lowest. All 10 lowest-scoring states are in the South.
Yes — 715 falls in FICO’s “Good” tier (670–739), which qualifies you for most credit products. However, it’s not enough for the best rates. To unlock top mortgage rates in 2026, you need 760+ (the current average approval score for mortgage lenders). For the best auto loan and credit card rates, target 740+. See: What Is a Good Credit Score?
Three causes: (1) Federal student loan delinquency reporting resumed in February 2025 after a multi-year pandemic pause. (2) 90-day delinquency rates hit 8.3% — above pre-pandemic levels. (3) Average credit card balances rose to $6,360 per person, pushing utilization to 35.5%.
About 24% of Americans have an exceptional FICO score of 800 or above, according to 2025 Experian and Motley Fool data. Only 1.7% achieve a perfect 850.
The average US VantageScore is 702 as of early 2026 (March 2025 data per NerdWallet, December 2025). VantageScore was recently approved for use in Fannie Mae / Freddie Mac mortgage underwriting as of July 2025.
The average FICO score rose 28 points from 687 in 2010 to a peak of 717 in 2024. The current 715 is the first decline since 2014. Before the pandemic, the average was 703 (2019). The pandemic-era stimulus and loan forbearance programs temporarily pushed scores much higher before the recent reversal.
It depends on the strategy. Lowering credit utilization below 10%: 30 days. Disputing errors: 30–45 days. Becoming an authorized user: 30–60 days. Building from scratch (580→700): 12–24 months. The fastest legitimate improvement most people can achieve is 20–50 points in 30–45 days by paying down credit card balances.
No — income is not a direct factor in FICO or VantageScore calculations. However, higher income makes it easier to pay on time and keep utilization low, which are the two most important factors. This is why high-income Americans average 750+ while low-income Americans often fall below 670.
📈 Beat the 715 National Average — Start Today
The national average dropped for the first time in 11 years. Don’t follow it down. Our complete 11-step guide shows you exactly how to improve your score — with real timelines and the actual dollar savings at each tier.
Related Spendzila Guides:
→ What Is a Good Credit Score in 2026?
→ How to Improve Your Credit Score (11 Steps, March 2026)
→ Best Debt Consolidation Loans 2026
→ Best Personal Loans 2026 (Rates from 6.99%)
→ Small Business Loans 2026 — Complete Guide
Manage your cookie preferences below. Essential cookies are required for the site to work. Your financial calculator data is never stored in cookies.
Necessary for basic site functionality — navigation and forms. Cannot be disabled.
Google Analytics (anonymized) — helps us understand how visitors use the site. No personal data collected.
Google AdSense — used to show relevant ads. Helps keep Spendzila free for everyone.
Remember your last-used tool or tab for a better experience. No financial data stored.


Be the first to leave a comment!
Leave a Comment